


Six numbers determine whether a gallery’s inventory is working for the business or quietly draining it: inventory turnover, days in inventory, sell-through rate, average sale price, gross margin per sale (or artist profitability), and stock value concentration. Tracking these gallery inventory metrics monthly, rather than reviewing them once a year at tax time, keeps cash from getting stuck in slow-moving stock and gives you real data for pricing and acquisition decisions. Galleries using structured tracking systems like Artworksoft typically catch these patterns before they become cash-flow problems.
Methodology:
- Monitoring inventory turnover and days in inventory on a monthly basis helps identify slow-moving stock before cash-flow problems arise.
- Tracking artist-specific stock value concentration prevents overexposure to a small group of artists or pieces that could threaten inventory risk management.
- Structured data collection through regular audits, location tracking, and invoice linkage ensures KPI accuracy, reducing reliance on inconsistent manual records.
- Real-time dashboards powered by gallery software enable early detection of inventory issues, like aging stock or over-concentrated relationships, supporting proactive decision-making.
- Seasonal market fluctuations and market trends must be considered when analyzing metrics to avoid misinterpreting temporary dips as systemic demand declines.
Table of Contents
- What Are the Core Gallery Inventory Metrics?
- How Do You Calculate Each KPI?
- Where Does the Data for These Metrics Actually Come From?
- How Often Should You Review Gallery Performance Metrics?
- How Does Gallery Software Turn These Metrics Into a Working Dashboard?
- Case Studies: How Galleries Improved Performance Using Inventory Metrics
- How Do Market Trends and Seasonality Affect Gallery Inventory Metrics?
- What Are the Common Pitfalls in Tracking Gallery Inventory KPIs?
- An Editorial Perspective on Inventory as Your Largest Tied-Up Asset
- How Artworksoft Helps You Build a Working KPI Program
- Sources
What Are the Core Gallery Inventory Metrics?
Each of these six metrics answers a distinct business question, and none of them work in isolation. A gallery with strong sell-through but weak margins is discounting too aggressively. A gallery with high average sale price but poor turnover may be sitting on inventory that looks impressive but doesn’t move.
- Inventory turnover measures how many times your stock effectively sells through in a period, and it’s the single clearest signal of whether capital tied up in artwork is generating returns. It’s an annual metric, typically owned by whoever manages gallery finance.
- Days in inventory converts turnover into a timeframe: how long, on average, a piece sits before it sells. Curators and gallery managers use this to flag underperforming shows or price points.
- Sell-through rate tracks the percentage of available works that actually sold within a period or show. It’s operational, reviewed after every exhibition, and one of the fastest ways to judge whether a program worked.
- Average artwork sale price shows whether pricing strategy and positioning are holding, rising, or slipping. It’s commercial, monthly, and directly tied to how you set expectations with consigning artists.
- Gross margin per sale, or artist profitability when you’re comparing relationships rather than single transactions, tells you which sales actually make money after artist share, framing, shipping, and fair fees.
- Stock value concentration identifies how much of your total inventory value sits in a small number of pieces or artists, which matters enormously for risk management.
Turnover, days in inventory, and margin all require audit data on current stock value. Sell-through and average sale price come straight from transactional records. Attendance and conversion metrics appear alongside these in most sector KPI frameworks, but they measure foot traffic, not inventory health.
How Do You Calculate Each KPI?
The formulas are simple. The discipline of running them monthly, on clean data, is where most galleries fall short.
| Metric | Formula |
|---|---|
| Inventory turnover | Cost of goods sold (or sales) ÷ average stock value |
| Days in inventory | 365 ÷ turnover |
| Sell-through rate | Items sold ÷ items available |
| Average sale price | Total sales ÷ number of pieces sold |
| Gross margin per sale | (Sale price − costs) ÷ sale price |
Worked example: A mid-size gallery carries an average stock value of $400,000 across the year and records $600,000 in sales. Turnover comes out to 1.5. Divide 365 by 1.5 and you get roughly 243 days in inventory, meaning a typical piece sits eight months before it sells.
That’s a meaningful number to sit with. [Benchmark](https://www.finance strategists.com) ranges for annual turnover generally fall between 1.0 and 2.0, though the range shifts with gallery model: a contemporary gallery pushing emerging artists at lower price points often turns inventory faster than a blue-chip secondary-market dealer holding six-figure pieces for years by design. A moderate turnover rate might be healthy for one gallery and alarming for another.
For stock value concentration, apply a Pareto lens: rank pieces or artists by value, then check what share of total inventory value sits in the top 20%. If that number exceeds 50%, your risk exposure to a handful of relationships is significant, and it’s worth stress-testing what happens if one artist stops producing or one major piece fails to sell.
Where Does the Data for These Metrics Actually Come From?
Clean gallery performance metrics depend on clean inputs, and inputs come from three places: physical audits, transactional records, and movement logs.
- Run physical inventory audits at least quarterly, with a full annual audit as the anchor event. Each audit should produce a signed condition report, updated provenance notes, and current photographs shot to a consistent standard so condition changes are visible over time.
- Structure every record around a unique ID tied to a location hierarchy (storage room, gallery wall, off-site, in-transit), a clear consignment-versus-owned flag, and a full movement history from acquisition to sale or return.
- Link every invoice back to its inventory record so sales data and stock data never live in separate systems that have to be reconciled by hand.
For pieces traveling to fairs or off-site shows, scan inventory before departure and again on return, and assign a dedicated off-site location code. This single habit prevents the phantom stock and double-counting that quietly corrupt turnover calculations. QR or barcode labeling makes this fast enough to do consistently rather than only when someone remembers.
Pro Tip: Use a rolling 12-month window for turnover to catch long-run trends, but track days in inventory on a 90-day view too. A single slow-moving show can distort your annual number for months if you’re only looking at the yearly figure.
How Often Should You Review Gallery Performance Metrics?
Match the review cadence to the decision the metric is meant to inform. Checking sell-through weekly during a show makes sense. Checking gross margin weekly does not, because the inputs don’t change that fast.
- Weekly: operational checks, sales velocity during active shows, and any off-site inventory reconciliation.
- Monthly: full KPI dashboard review, including turnover, days in inventory, average sale price, and margin by channel.
- Quarterly: strategy-level review covering stock concentration, artist profitability trends, and acquisition planning.
Build your dashboard around a small number of panels: stock age distribution, sales performance by artist, margin by sales channel, and an upcoming loan or sale pipeline. Set decision triggers in advance rather than reacting case by case. If days in inventory on a piece crosses 365, that’s a signal to reprice, relocate, or reconsider consignment terms. If one artist represents more than 40% of stock value, that’s a trigger to diversify acquisitions before you review the number again. Sector guidance on cultural venue KPIs consistently recommends this short-cycle-plus-monthly structure over ad hoc reviews, because it catches problems while they’re still cheap to fix.
How Does Gallery Software Turn These Metrics Into a Working Dashboard?
Every KPI above maps to a specific data field, and specialized art inventory management software is what turns scattered records into a live dashboard instead of a quarterly spreadsheet exercise.
- Artworksoft’s structured valuation formula feeds average sale price and margin calculations directly, removing the guesswork that creeps in when pricing is set informally.
- Movement and location tracking logs every transfer automatically, which is what makes days-in-inventory calculations accurate instead of estimated.
- Audit and condition reports generated in the platform give you the stock-age and provenance data that manual spreadsheets usually let slip.
- Built-in sales and transaction reporting ties directly to sell-through and turnover without a separate reconciliation step.
To get started: import your existing inventory, tag each record with location and consignment status, run a first full audit to establish your baseline, then set alerts on your key thresholds.
Pro Tip: Don’t try to track all six metrics manually before switching systems. Import your inventory first, then let the software recalculate history. Retrofitting clean data is faster than auditing a spreadsheet by hand.
Case Studies: How Galleries Improved Performance Using Inventory Metrics
Galleries that shift from annual stocktaking to monthly KPI review tend to find the same pattern: a small number of pieces or artists account for most of the tied-up capital, and nobody had quantified it before.
One common scenario plays out at mid-size contemporary galleries carrying 200 to 400 active pieces. Once they start tracking days in inventory by artist rather than in aggregate, a clear outlier usually emerges, often a single relationship or series that has quietly sat unsold for well over a year while newer work turns in under six months. The fix isn’t dramatic: reprice the aging stock, renegotiate consignment terms, or return pieces that have exceeded a reasonable holding period. Galleries applying artist-level profitability tracking rather than judging relationships on gross sales volume alone tend to make these calls faster, because the 80/20 concentration effect is usually visible within the first full audit cycle.

Another recurring pattern shows up around fair participation. Galleries that started reconciling off-site inventory with dedicated location codes and pre/post-event scans reported catching discrepancies between what left the gallery and what came back, discrepancies that had previously gone unnoticed for months because inventory and sales records lived in separate systems. The lesson isn’t that any single metric transformed the business. It’s that consistent measurement surfaced problems that instinct alone had missed.
How Do Market Trends and Seasonality Affect Gallery Inventory Metrics?
Inventory metrics don’t move in a vacuum, and reading them without context leads to bad decisions. A dip in turnover during a slow summer month or a post-holiday lull isn’t the same signal as a structural decline in demand for a particular artist or medium.
Seasonality shows up most clearly in sell-through rate and average sale price. Fair season and major auction cycles tend to pull collector attention and budget away from standing gallery inventory, which can depress sell-through even when the work itself hasn’t changed in quality or pricing. Conversely, a gallery’s own opening or a well-timed show tied to a fair week can spike turnover temporarily in a way that doesn’t reflect year-round demand.
Broader market trends matter too. A cooling secondary market for a particular movement or medium can extend days in inventory across an entire category of stock, not just one artist’s work, which is why comparing a single piece’s performance against category-wide trends matters before assuming something is priced wrong. This is where a rolling 12-month turnover view earns its keep: it smooths out seasonal noise while still catching genuine shifts in demand.
The practical takeaway is to benchmark performance against the same period in prior years, not just against the previous month. A gallery specializing in outdoor sculpture will see very different seasonal patterns than one focused on works on paper, and neither pattern is a flaw, just a variable to build into how you read the numbers.
What Are the Common Pitfalls in Tracking Gallery Inventory KPIs?
Most galleries don’t fail at tracking KPIs because the formulas are hard. They fail because the underlying data is inconsistent, and inconsistent inputs produce numbers that look precise but mean nothing.
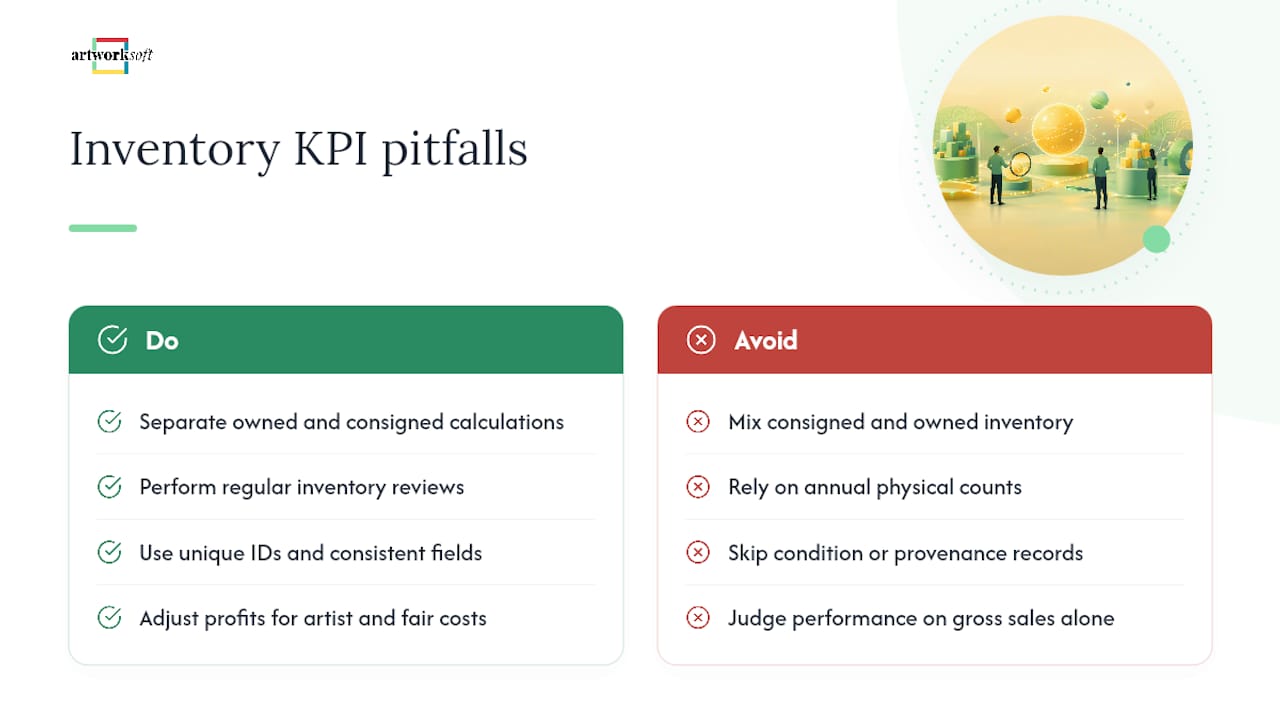
The most frequent mistake is blending consigned and gallery-owned inventory into a single turnover calculation. Consigned pieces don’t tie up the gallery’s own capital the way purchased inventory does, so mixing the two in one cost-of-goods calculation understates how efficiently owned capital is actually working. Running parallel calculations, one for owned stock using gallery cost basis, one for consigned stock using sales velocity, avoids this distortion.
A second common pitfall is treating an annual physical count as sufficient. Inventory that moves between storage, gallery walls, off-site loans, and fairs generates drift that an annual count simply can’t catch in time to act on. By the time a discrepancy surfaces, months of inaccurate days-in-inventory data have already shaped pricing decisions.
Inconsistent condition and provenance documentation causes a quieter problem: it undermines valuation confidence, which ripples into average sale price and margin figures. And galleries that judge performance purely on gross sales, without adjusting for artist share, framing, and fair costs, routinely overestimate which relationships are actually profitable. The fix for all four issues is the same: structured, unique-ID-based records with consistent fields, reviewed on a fixed cadence rather than reconstructed from memory when a report is due.
An Editorial Perspective on Inventory as Your Largest Tied-Up Asset
For most galleries, inventory is the single largest asset on the books, yet it gets less rigorous measurement than payroll or rent. That imbalance is worth correcting first, before adding more sophisticated analytics. Liquidity, not aesthetic judgment, is what determines whether a gallery survives a slow year, and turnover is the cleanest proxy for liquidity available.
The 80/20 effect deserves more attention than most galleries give it. A handful of artists or pieces typically account for most tied-up value, which means risk concentration is often far higher than intuition suggests.
Start small. Track turnover, days in inventory, and average sale price for one full quarter before adding margin and concentration metrics. Small, repeatable audit processes beat ambitious systems that collapse under their own complexity.
— Nealda
How Artworksoft Helps You Build a Working KPI Program
Artworksoft is built specifically for the gallery workflows this article walks through, not adapted from generic retail inventory software. Its structured valuation formula generates the pricing and margin data behind average sale price and profitability tracking, while movement logs, audit reports, and sales transaction records feed directly into turnover and days-in-inventory calculations without manual reconciliation.

If you’re currently tracking these metrics in spreadsheets pulled together at tax time, two steps get you moving faster: download an audit template and use it to standardize your next physical count, then import your first 50 items into Artworksoft to see how the dashboard populates automatically as sales and movements happen. The free plan is built for exactly this kind of test run, and you can generate your first asset report before deciding whether to expand to full inventory migration.
Sources
- Performance indicators every gallery should track monthly
- What are core 5 KPIs of Art Gallery Business?