


The KPIs that matter most for gallery performance are visitor count, artwork sales revenue, average sale price, conversion rate, average visitor spend, exhibition cost per visitor, marketing ROI, customer satisfaction or NPS, inventory accuracy, days-to-sale, membership conversion, and cash-flow run rate. Tracking them together drives three outcomes: more repeat visitors, higher sales per visit, and predictable cash flow. Together they turn gallery management from guesswork into a measurable practice.
TL;DR:
- Revenue and average sale price are heavily influenced by consistent data collection at purchase, with 180 days being a typical threshold for price reductions on unsold works.
- Visitor retention metrics, such as repeat visits and membership conversions, directly impact long-term audience growth but require careful tracking through email or CRM systems.
- Marketing ROI should include attribution windows of several weeks post-campaign to accurately measure its effect on sales, with performance monitored via social media engagement and inquiries.
- Operational KPIs like exhibition cost per visitor and inventory accuracy help optimize spending efficiency and speed up sales by maintaining well-documented collections.
- Prioritize cash-flow run rate, monthly sales revenue, and visitor-to-buyer conversion first, reviewing these weekly during staff meetings to ensure financial stability.
Table of Contents
- Revenue and sales KPIs
- Audience and engagement KPIs
- Marketing and digital KPIs
- Operational and financial KPIs
- Collections and inventory KPIs
- Applying KPIs in practice: templates, dashboards, and reporting cadence
- Monitoring online engagement for virtual exhibitions
- Author perspective: which KPIs to prioritize right now
- Artworksoft: how we support gallery KPI tracking
- FAQ
- Sources
Revenue and sales KPIs
Artwork sales revenue and sales volume form the foundation of gallery financial reporting. Sales volume counts the number of works sold in a period; revenue totals the dollar amount across those sales. Both depend on consistent data fields recorded at the point of sale: transaction date, artwork ID, sale price, and buyer.
Average artwork sale price divides total revenue by units sold, giving a quick read on whether a gallery is moving higher-value or lower-value work. Average visitor spend takes total sales revenue divided by total visitors over the same period, usually pulled from point-of-sale and ticketing data.
Conversion rate, the share of visitors who become buyers, is harder to pin down than it sounds. A practical method counts same-day sales plus any tracked inquiry that converts within a set window, often 30 to 60 days, since many collectors return after an initial visit.
When these numbers lag, a few responses tend to work:
- Review pricing against comparable works and recent sales history.
- Reach out directly to known collectors who have shown interest in similar artists.
- Bundle smaller works or offer payment plans to ease larger purchases.
- Adjust promotion timing so marketing peaks align with opening receptions.
Full sales reporting workflows can standardize how these fields get captured across a season.
Audience and engagement KPIs
Visitor count and exhibition attendance are the starting point for almost every other metric on this list. Ticketing systems, door counters, and RSVP logs each capture attendance from a different angle, and most galleries check this figure daily during a show and monthly for trend reporting.
Repeat visitation and membership conversion reveal whether a gallery is building a durable audience rather than one-off foot traffic. Tracking repeat visits through email or CRM records, alongside membership enrollment rates, lets a gallery set a retention target and measure progress against it season over season.
Visitor satisfaction deserves its own line. Short exit surveys or structured instruments modeled on COVES give galleries a repeatable way to score the visit experience rather than relying on impressions.
Front-line staff interactions have an outsized effect on how visitors rate their experience and whether they return, according to American Alliance of Museums research, with dissatisfied visitors causing disproportionate reputational damage.
A few measurement notes matter here:
- Use quick digital surveys for broad reach and in-person intercepts for depth.
- Aim for enough responses to draw reliable conclusions, not just a handful of comment cards.
- Review display layout and visitor flow alongside satisfaction scores, since circulation design often explains dips in engagement.
Marketing and digital KPIs
Marketing ROI for a gallery campaign is calculated as revenue attributed to the campaign minus campaign cost, divided by campaign cost. Attribution windows matter: a gallery promoting an opening should track sales for several weeks after the event, since art purchases rarely happen on impulse during a single visit.
Beyond ROI, a handful of supporting metrics round out the picture:
- Social media engagement rate across posts tied to a specific exhibition.
- Website inquiries generated by a campaign or landing page.
- Newsletter open and click rates segmented by exhibition announcement.
- Online sales or inquiry volume compared to in-gallery activity.
Cost per acquisition, the marketing spend required to generate one buyer, works best when tracked with UTM-tagged links, unique phone or text codes on print materials, and a simple “how did you hear about us” question on post-visit surveys. Market research on buyer channel preference suggests collectors increasingly discover and purchase through dealer websites, which makes digital attribution worth the setup effort.
Report marketing metrics monthly, then translate any uplift into an expected sales number using the gallery’s own conversion rate rather than an industry average.
Operational and financial KPIs
Exhibition cost per visitor divides total exhibition expenses, including install, marketing, and staffing for that show, by total attendance. This figure lets a gallery compare the efficiency of a quiet solo show against a heavily promoted group exhibition.
A short set of financial metrics keeps a gallery solvent:
- Calculate gross margin on art sales by subtracting commission, framing, and shipping costs from sale price, then dividing by sale price.
- Track labor-cost ratio as total staff cost divided by total revenue; many small and mid-size galleries aim to keep this below 30%.
- Build a rolling three-month cash-flow projection rather than relying on an annual budget, since cash-flow volatility is a more common cause of gallery failure than weak sales alone.
- Review inventory turnover and days-to-sale monthly to catch slow-moving work before it ties up capital.
Pro Tip: When a work passes 180 days without an offer, consider a price reduction or a consignment arrangement rather than letting it sit at full retail indefinitely.
Collections and inventory KPIs
Inventory accuracy rate measures the percentage of recorded artworks whose location, condition, and status match physical reality during an audit. Quarterly audits catch discrepancies before they become a problem during a sale or loan.
Valuation completeness tracks the gap between estimated value and realized price, along with the percentage of works carrying full documentation such as a Certificate of Authenticity. Buyers move faster when provenance and condition reports are already assembled rather than requested after an offer.
A short list of fields keeps inventory KPIs reliable:
- Current location and movement history for every piece.
- Condition notes updated after each loan or exhibition.
- Provenance documentation status, flagged as complete or pending.
- Estimated value versus most recent realized sale price for comparable work.
Galleries that tighten these fields tend to see faster closing times, since documentation gaps are one of the more common points of friction in a sale.
Applying KPIs in practice: templates, dashboards, and reporting cadence
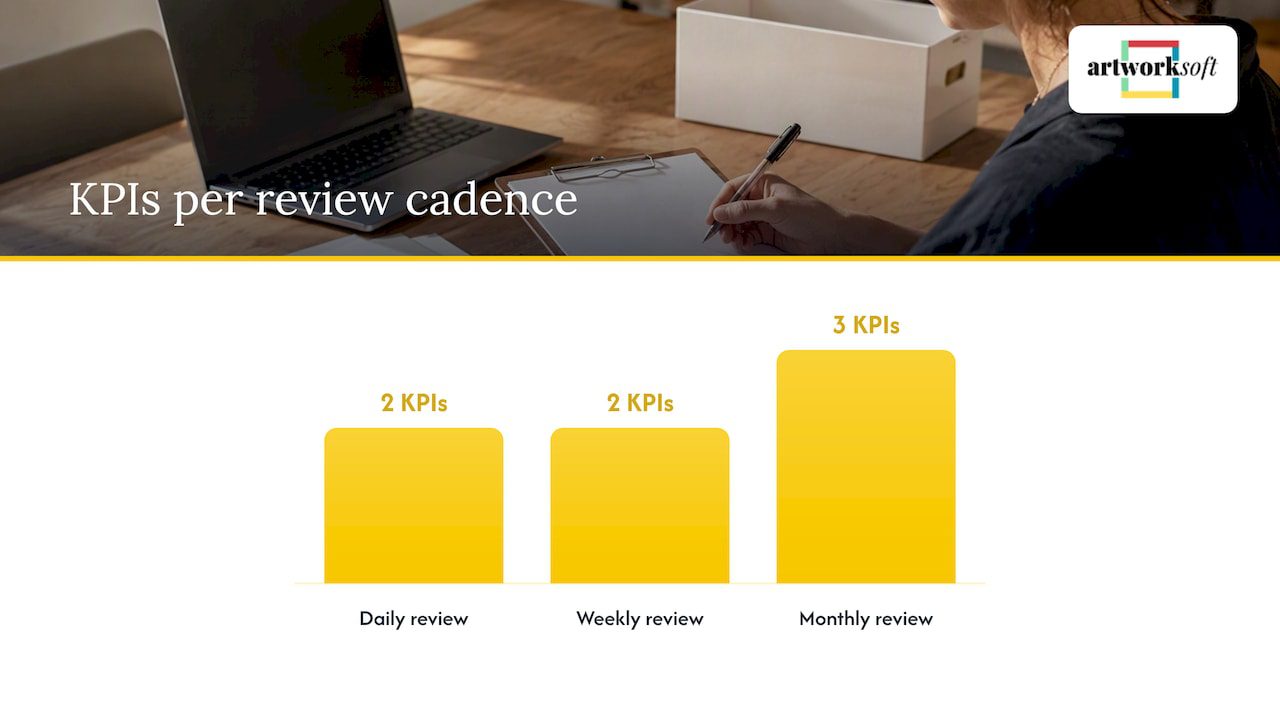
A working dashboard groups KPIs by how often they need review, not by department. Daily fields cover sales and visitor count. Weekly fields cover campaign performance and a quick pulse-check on visitor sentiment. Monthly fields cover revenue, margin, and inventory turnover.
Data sources map directly onto these fields: point-of-sale systems feed sales KPIs, ticketing feeds attendance, CRM feeds membership and repeat-visit rates, and the inventory system feeds valuation and documentation completeness. Structured valuation and complete documentation, the kind generated through a platform like Artworksoft’s Certificate of Authenticity tools, shorten time-to-sale because buyers spend less time verifying provenance before committing.
| Cadence | KPIs tracked | Primary data source |
|---|---|---|
| Daily | Visitor count, same-day sales | Ticketing, point of sale |
| Weekly | Campaign ROI, quick satisfaction pulse | Marketing platform, exit survey |
| Monthly | Revenue, gross margin, inventory turnover | Accounting system, inventory records |
A short rollout plan works for most galleries:
- Week one: audit existing data sources and fix obvious gaps.
- Week two: pick three priority KPIs tied to the gallery’s current stage.
- Week three: build a one-page dashboard pulling from existing systems.
- Week four: run the first monthly review and adjust targets.
Monitoring online engagement for virtual exhibitions
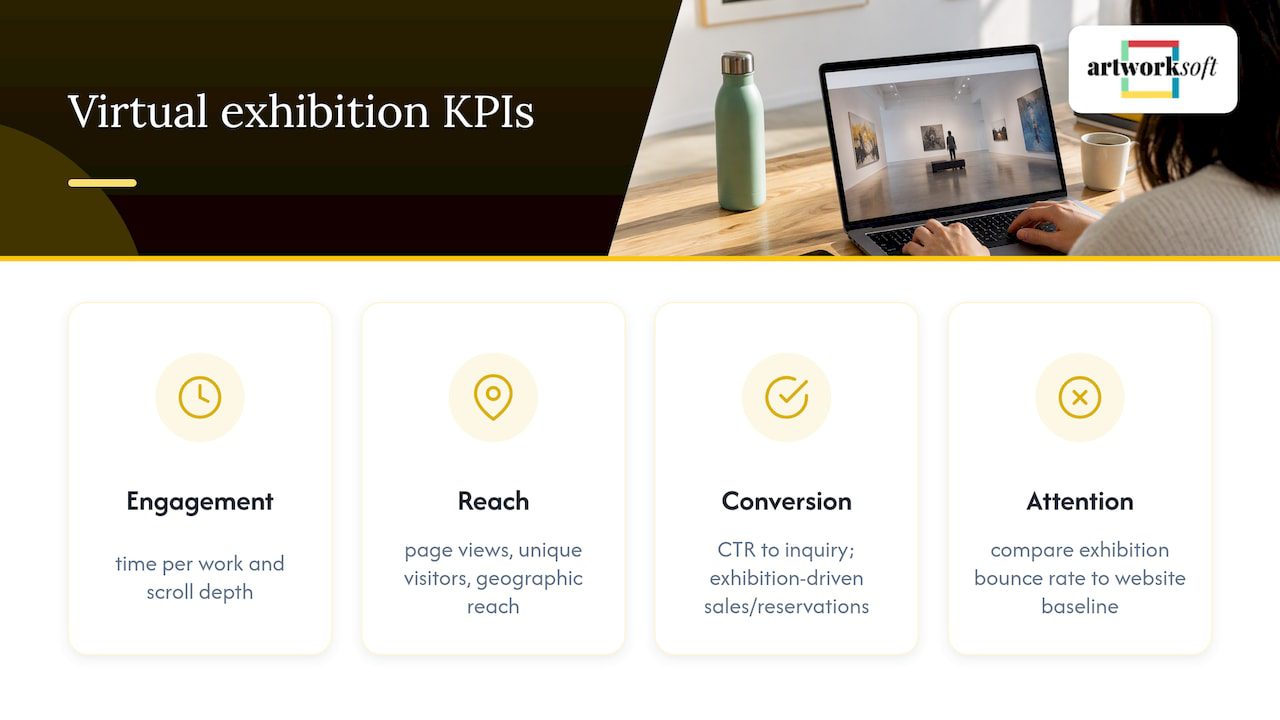
Virtual exhibitions and online viewing rooms need their own engagement metrics, separate from in-person attendance, because the behavior patterns differ. Page views and unique visitors to an online exhibition give a baseline, but time spent per work and scroll depth on artwork detail pages reveal whether online visitors are actually engaging with the art or skimming past it.
Click-through rate from an online exhibition to an inquiry form measures digital conversion, the equivalent of a visitor approaching gallery staff in person. Online sales or reserved-work requests generated directly from a virtual exhibition should be tracked separately from general website sales, since they indicate the exhibition format itself is driving transactions rather than general brand awareness.
Geographic reach is worth tracking too. Online exhibitions often draw visitors well outside a gallery’s physical radius, and that data can shape which artists or price points get promoted in future digital-only shows. Comparing bounce rate between an online exhibition landing page and the general website helps isolate whether the exhibition content itself holds attention or simply inherits existing site traffic.
Report these metrics on the same monthly cadence as other marketing KPIs, and compare virtual exhibition performance against the in-person show it accompanies when one exists. A gallery running both formats for the same body of work gets a direct read on which channel converts better for that particular artist or price range, information that shapes where future promotional budget goes.
Author perspective: which KPIs to prioritize right now
Not every KPI deserves equal attention from day one. Cash-flow run rate and monthly sales revenue come first, because a gallery that runs out of cash never gets to optimize anything else. Audience and marketing metrics come second, once the financial floor is stable. Optimization metrics like inventory turnover and documentation completeness come last, useful but not urgent in a crisis.
Three numbers worth checking this week: rolling three-month cash runway, monthly sales revenue against the same month last year, and conversion rate from visitor to buyer. None require new software, just consistent recording.
KPI tracking sticks when it becomes part of a weekly staff meeting rather than a quarterly report nobody reads. Assign one person to own the dashboard update, even if that person checks it for fifteen minutes each Monday.
— Nealda
Artworksoft: how we support gallery KPI tracking
We built our platform around the same data fields these KPIs depend on: artwork location, valuation, sales history, and documentation status, all connected instead of scattered across spreadsheets and filing cabinets. A structured valuation formula removes the guesswork from pricing decisions that feed directly into average sale price and margin tracking, and sales and transaction reporting keeps revenue and conversion data together instead of scattered.

For galleries ready to start tracking these metrics without rebuilding their systems from scratch, we recommend a practical sequence:
- Start with our Free Plan to get inventory and valuation data organized first.
- Run a 30-day audit of existing records before adding new KPIs to the mix.
- Consider our Onboarding & Collection Management Service if your team needs hands-on help setting up inventory and documentation workflows.
Certificates of Authenticity generated directly from artwork records cut the back-and-forth that slows down a sale, which matters most when days-to-sale is one of the KPIs you are actively trying to shrink.
FAQ
What are the 5 key performance indicators for a gallery?
Most galleries prioritize visitor count, artwork sales revenue, conversion rate, average visitor spend, and cash-flow run rate as a starting set. These five cover attendance, financial health, and sales efficiency without requiring extensive new data collection.
What are the top 3 KPIs for a small gallery?
For a gallery with limited reporting resources, monthly sales revenue, rolling cash-flow projection, and conversion rate from visitor to buyer matter most. These three reveal whether the gallery can cover its costs and whether its sales process is working.
What are some good KPI examples beyond sales?
Strong non-sales examples include repeat visitation rate, membership conversion, inventory accuracy, and customer satisfaction scores gathered through exit surveys. Sector resources like industry KPI lists for arts organizations commonly group these alongside attendance and revenue.
What are the four main KPI categories for galleries?
Gallery KPIs generally fall into four groups: sales and revenue, audience and engagement, marketing and digital performance, and operational or financial health. Collections and inventory metrics often form a fifth category when a gallery manages a larger or more complex inventory.
How often should a gallery review its KPIs?
Sales and visitor numbers work best checked daily or weekly, while margin, inventory turnover, and satisfaction scores suit a monthly review. Matching the review cadence to how fast each metric changes keeps reporting useful instead of overwhelming.